The brain is the supercomputer of the body. It is a complex network of computational units, all working together to control our bodies and provide us with thoughts and emotions. We have come to better understand the inner workings of the brain by studying brain connectivity, but we still have a lot to learn. Recently I defended my PhD thesis, in which I studied the relationship between the brain’s function, it’s underlying connectivity, and disconnection resulting from lesion development. In this post I will give an introduction to these concepts using images from my thesis and defense presentation.
Brain anatomy
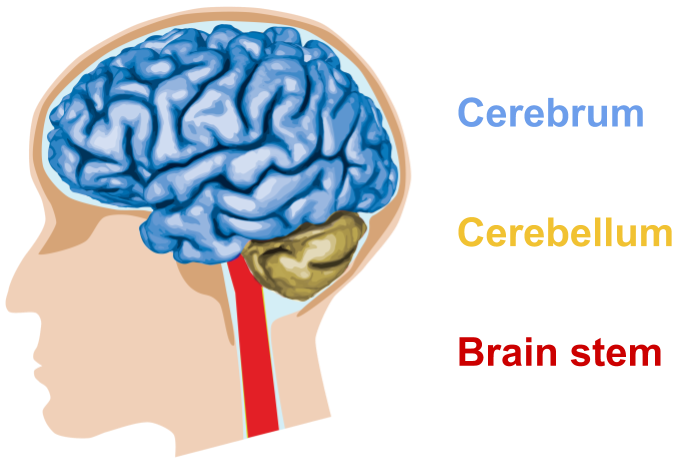
The brain is protected by the skull and cerebral spinal fluid. It can be divided into three parts.
- The brain stem provides basic bodily functions such as breathing, swallowing, heart rate and blood pressure
- The cerebellum controls muscle movements, posture and balance
- The cerebrum interprets senses and emotions, and is responsible for reasoning, learning and fine motor control
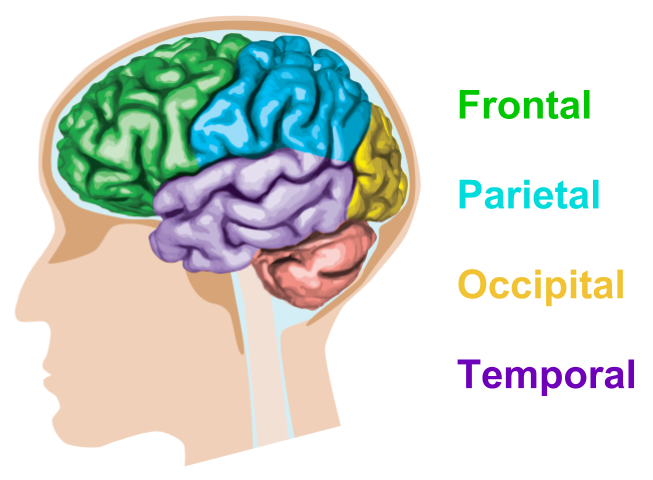
The cerebrum can be further subdivided into four brain lobes.
- The frontal lobe controls voluntary movement, thinking, decision making and planning
- The parietal lobe processes taste, temperature and touch
- The occipital lobe is responsible for visual processing
- The temporal lobe controls hearing, selective listening, speech comprehension

The cerebrum is composed of two types of tissue: white matter and grey matter. Grey matter is where brain function originates. It is found both on the surface of the brain, which is referred to as the cortex, and deep in the brain, which is referred to as the subcortex. Grey matter can be further subdivided into regions of interest. In most of my thesis I used the FreeSurfer Desikan-Killiany atlas (shown below). For example, the thalamus is a subcortical grey matter region that is associated with memory, sleep, emotion and executive function.
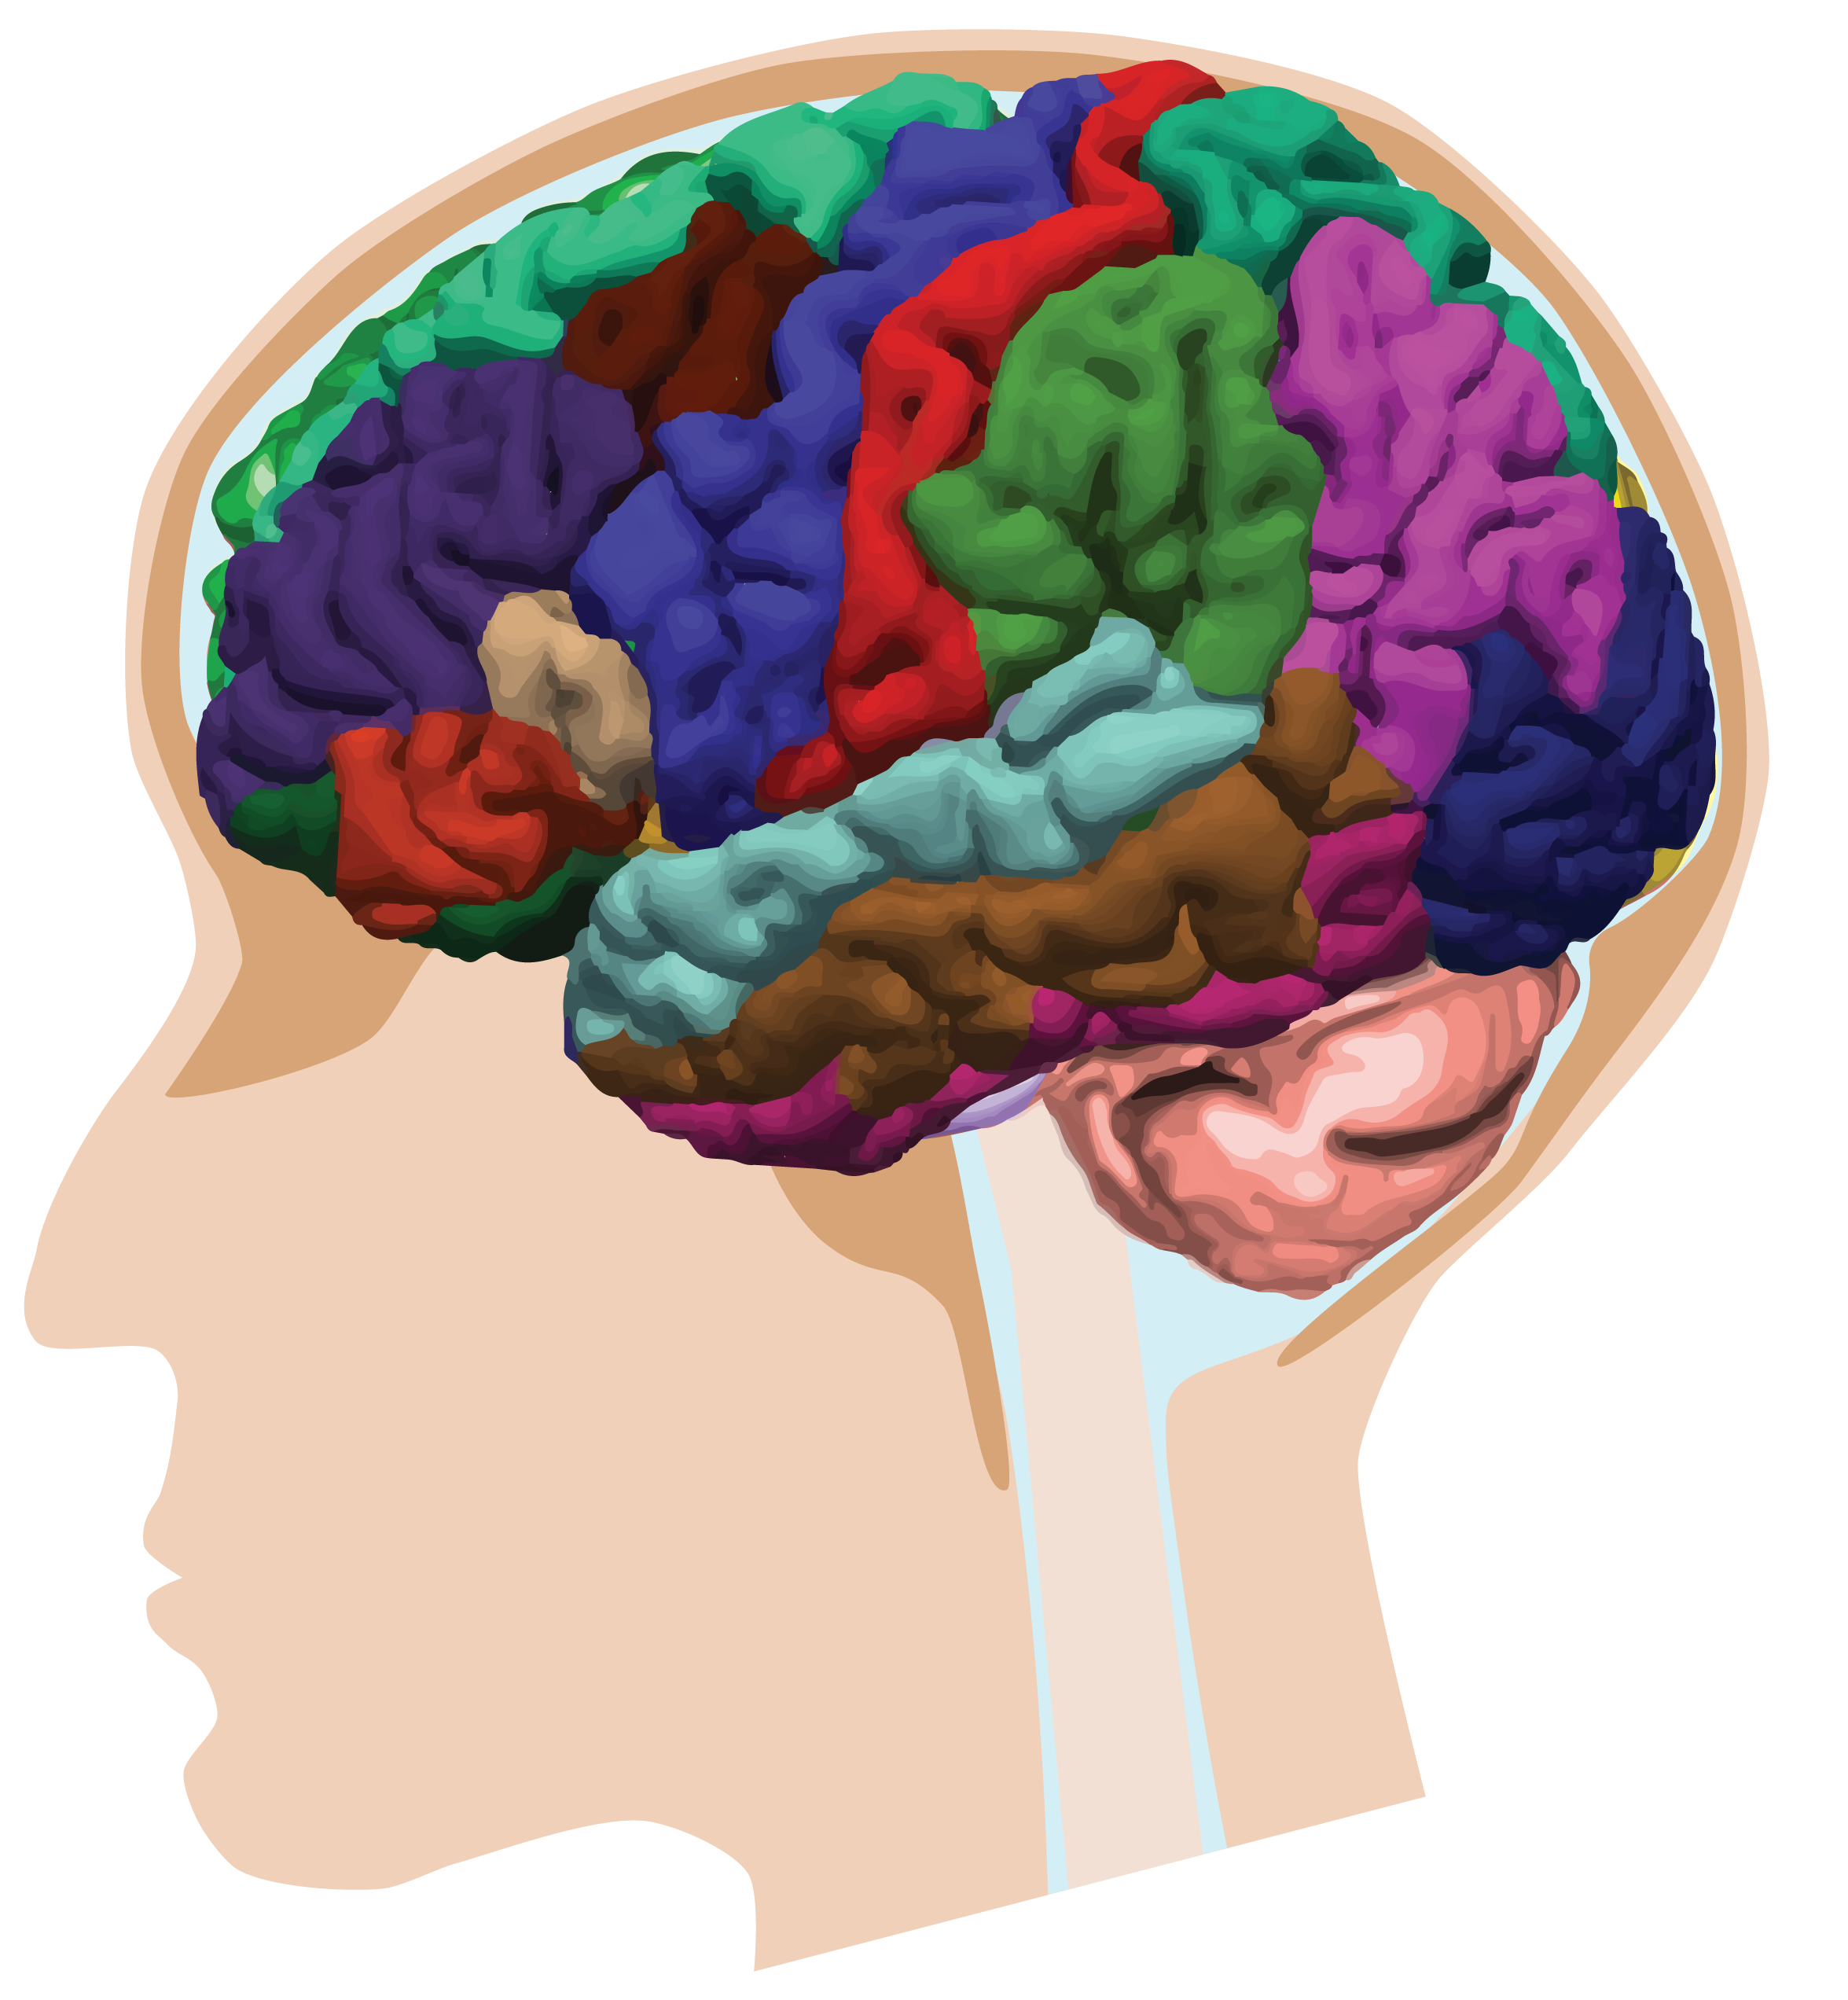
Grey matter regions are connected to each other by white matter tracts, much like components of a computer are connected to each other by circuits. For example, the thalamus is connected to the occipital lobe by the posterior thalamic radiations. Signals are passed between regions, thus allowing communication and consequently higher brain functions.
The brain can be non-invasively examined using magnetic resonance imaging (MRI):
- Structural MRI is used to visualize anatomy
- Functional MRI is used to estimate brain function
- Diffusion MRI is used to estimate w**hite matter pathways**
The connectome
Before we can analyze brain connectivity computationally, we need to represent it in a data structure. The connectome is a data structure which represents brain connectivity as a network of connections between brain regions. It has been used to gain new insights into brain health, disease and function. In order to consider connectivity and the connectome, let’s consider a small toy example.
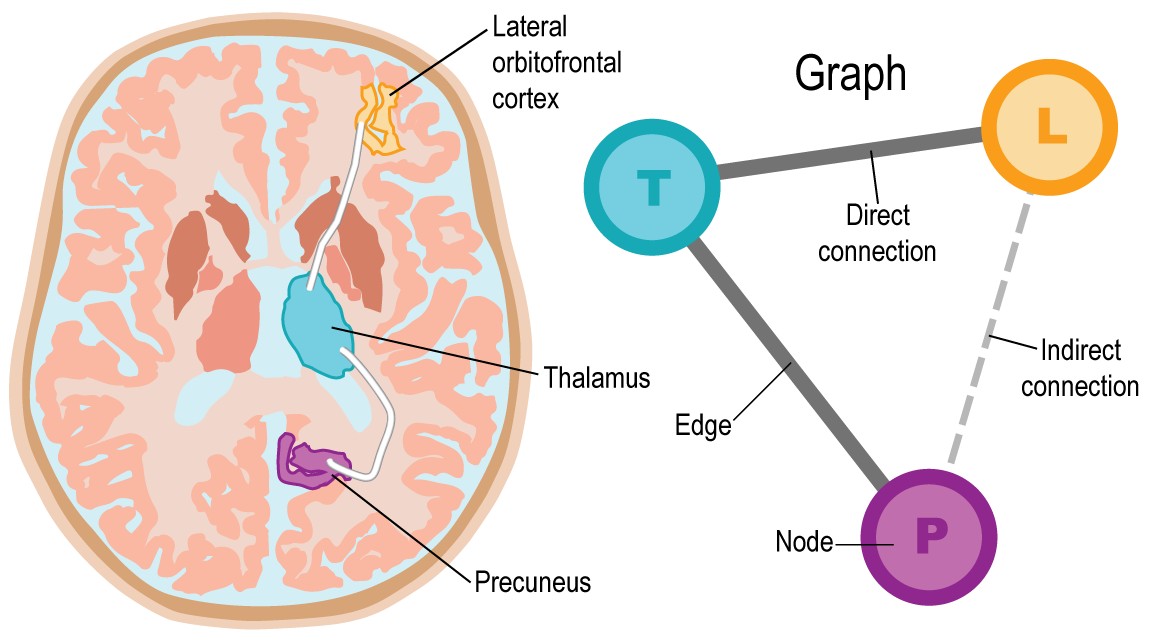
The thalamus is connected to the precuneus via the posterior thalamic radiations and to the lateral orbitofrontal cortex via the anterior thalamic radiations. In the connectome, regions are referred to as nodes. In this case, there are three nodes, one for each anatomical brain region. Connections between regions are referred to as edges. If we define edges where there is direct connectivity via white matter tracts, then there would be two edges: one between the thalamus and precuneus, and the other between the thalamus and lateral orbitofrontal cortex. Together the nodes and edges form a graph, which is the connectome.
There are several types of connectomes, each with their own edge definition. Direct physical connectivity via white matter tracts is represented by the structural connectome. These physical connections allow brain regions to communicate with each other by sending signals over the white matter tracts. However, regions which are not physically connected to each other can also communicate by sending signals via an intermediate region. Tracts are often defined by tracing streamlines through the white matter, where an edge is defined over the streamlines which intersect with the two associated regions. There are a variety of ways to define streamlines, and several ways to quantify connectivity. I won’t address them in this blog post.
Both direct and indirect indirect communication can be captured using the functional connectome, which often defines functional connectivity as the correlation (or some other measure of similarity) of activity in brain regions. In this example, the functional connectome has edges between all pairs of regions, two of which are direct connections, and one of which is an indirect connection between the precuneus and lateral obitofrontal cortex.
The disconnectome
Brain connectivity studies often do not take the presence or location of potential brain pathologies, such as white matter lesions, into account. Pathologies can have a negative effect on brain function. Presumably, lesions impede signal transmission along white matter tracts, leading to a reduction in function. They are thus a form of disconnection in the brain.
Lesions are detectable using MRI. In order to localize lesions within the connectome, we introduced the structural disconnectome.

In this example, the connectivity and disconnectivity between three brain regions is represented, where the red spot in the brain represents a lesion. Connectome edges can be defined as the number of streamlines which connect two regions. We defined disconnectome edges to be the fraction of streamlines which pass through lesions. In this case, the green and orange regions are connected by two streamlines, thus the connectome edge weight is two. One of those streamlines passes through a lesion, thus the disconnectome edge weight is one half.
Visualization
The connectome and disconectome can have hundreds of nodes and thousands of edges. This high dimensionality makes these data structures difficult to visualize, analyze and interpret. The connectome has been visualized in a variety of ways. Here I’ll focus on a few visualizations, which we describe more thoroughly (along with other visualization and analysis methods) in this paper.
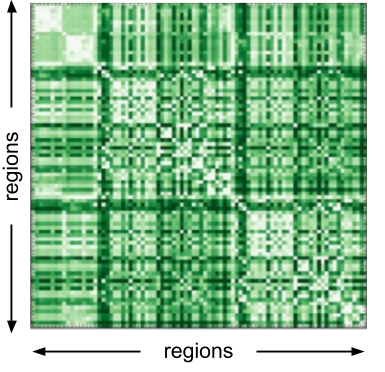 These visualizations includes the matrix representation, where regions are arranged along either axis and connections are represented as elements in the matrix. In this matrix, darker colors indicate higher connectivity. This visualization is ideal for representing dense connectomes, however it does not resemble structure of a graph which for some audiences might make it less intuitive.
Several studies have represented connectivity by plotting edges as lines within a 2D representation of brain (this article shows a few examples). While this gives an indication of anatomy and may be able to show some patterns of connectivity, the loss of the third dimension can result in overlapping nodes, which makes it difficult to examine individual nodes and edges. It is for this reason that we instead favored the connectogram.
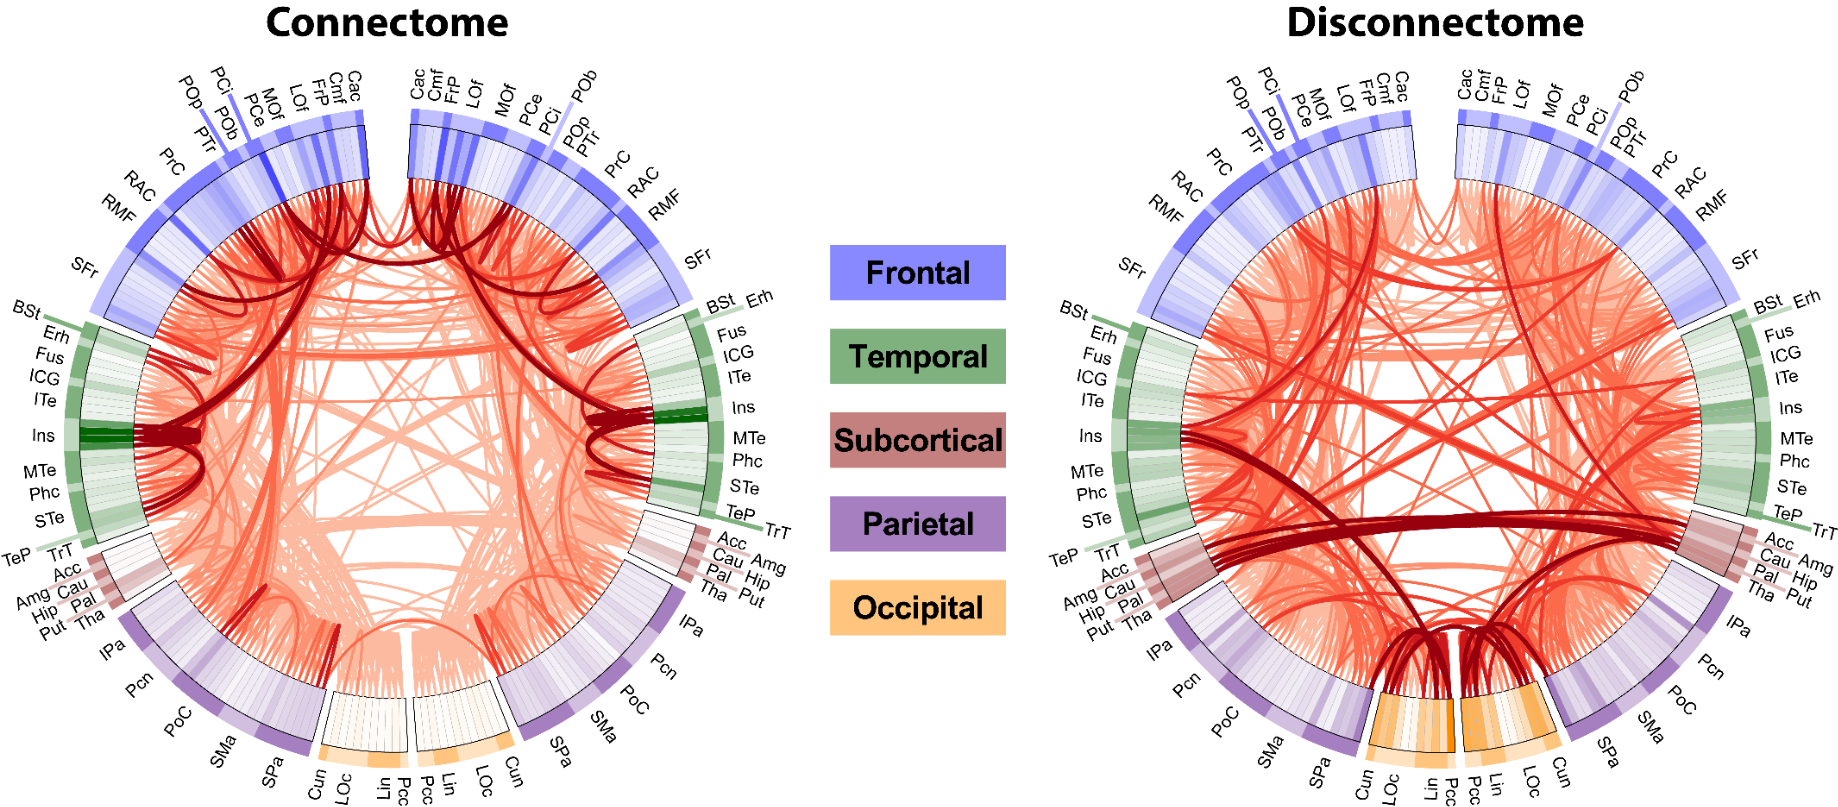
In the connectogram regions are arranged in a circle, where connections between regions are drawn in the center of the circle. Related regions can be grouped together. In this case they are grouped by brain lobe. The logical arrangement of regions allows for clear labelling and the structure of both the represented graph is obvious. However, it is not well-suited to show dense connectomes since overlapping lines obscure the view of other connections.
In all visualizations, hue and saturation can be used to indicate the sign and magnitude of either connection weights, or the relationships between connection weights and other variables such as age.
Applications
To date we have published several articles on both connectivity and disconnectivity, including:
- Integrated analysis and visualization of group differences
- An introduction to the disconnectome (from which the connectogram figure above is taken)
- Heritability of the connectome and disconnectome
- A tract-specific relationship between white matter lesions and functional connectivity (which doesn’t use the connectome or disconnectome, but rather estimates anatomically-defined white matter tracts)
My thesis also contains two studies which are currently under review on the topics of development of functional connectivity in children, and the relationship between (dis)connection and cognition.
I hope that you found this overview of brain connectivity and disconnectivity to be useful. If you have any questions, require additional details or want to discuss how to use these data structures in your own study then please let me know.